本文介绍在VPC网络下的ECS实例接入可观测监控 Prometheus 版后,如何监控ECS实例中的Java应用。
前提条件
已创建Java应用。
Spring Boot作为最主流的Java Web框架,在其生态中有着丰富的组件支持,可以通过Actuator和Micrometer很好地与可观测监控 Prometheus 版对接,因此,本文以Spring Boot Java应用为例。如果您还没有创建Java工程,可使用Java工程脚手架直接创建一个Java Maven Project。
已将VPC网络下ECS实例接入可观测监控 Prometheus 版。具体操作,请参见Prometheus实例 for ECS。
本文中的参数取值均为示例,您可以根据实际情况进行修改。
本文以Grafana 9.x版本为例进行说明。
操作步骤
在Project的pom.xml中添加以下依赖。
<dependency> <groupId>org.springframework.boot</groupId> <artifactId>spring-boot-starter-actuator</artifactId> <version>2.3.7.RELEASE</version> </dependency> <dependency> <groupId>io.micrometer</groupId> <artifactId>micrometer-registry-prometheus</artifactId> <version>1.5.1</version> </dependency>说明Spring Boot Actuator为Spring Boot提供了一系列产品级的特性:监控应用程序、收集元数据、运行情况或者数据库状态。更多详情,请参见Spring Boot文档。
Micrometer作为底层的度量工具,是监控度量的门面,相当于SLF4J在日志框架中的作用,其支持按照各种格式来暴露数据,包括Prometheus格式。
修改Spring Boot配置文件。
如果您的Spring Boot配置文件为application.properties格式,请参考以下命令修改配置。
# 应用名称
spring.application.name=demo

# 应用服务Web访问端口
server.port=8080

#可选配置
#management.endpoints.enabled-by-default=true
#management.endpoints.web.base-path=/actuator

#暴露Prometheus数据端点  /actuator/prometheus
management.endpoints.web.exposure.include=prometheus
#暴露的Prometheus数据中添加application label
management.metrics.tags.application=demo
如果您的Spring Boot配置文件为application.yml格式,请参考以下命令修改配置。
server:
  port: 8080
spring:
  application:
    name: spring-demo
management:
  endpoints:
    web:
      exposure:
        include: 'prometheus' # 暴露/actuator/prometheus
  metrics:
    tags:
      application: demo
检查服务。
启动应用后通过浏览器访问以下地址进行测试。
http://localhost:8080/actuator/prometheus说明请根据实际情况替换命令中的
localhost和端口。建议在其他ECS实例上也进行地址测试(http://[ECS IP]:port/actuator/prometheus),检查连接是否通畅,避免被安全组限制。
预计可得到以下返回结果。
# HELP jvm_memory_committed_bytes The amount of memory in bytes that is committed for the Java virtual machine to use
# TYPE jvm_memory_committed_bytes gauge
jvm_memory_committed_bytes{application="demo",area="heap",id="G1 Eden Space",} 1.30023424E8
jvm_memory_committed_bytes{application="demo",area="heap",id="G1 Old Gen",} 1.28974848E8
jvm_memory_committed_bytes{application="demo",area="nonheap",id="Metaspace",} 4.9627136E7
jvm_memory_committed_bytes{application="demo",area="heap",id="G1 Survivor Space",} 9437184.0
jvm_memory_committed_bytes{application="demo",area="nonheap",id="CodeHeap 'non-profiled nmethods'",} 7077888.0
jvm_memory_committed_bytes{application="demo",area="nonheap",id="Compressed Class Space",} 6680576.0
jvm_memory_committed_bytes{application="demo",area="nonheap",id="CodeHeap 'non-nmethods'",} 2555904.0
# HELP jvm_threads_states_threads The current number of threads having NEW state
# TYPE jvm_threads_states_threads gauge
jvm_threads_states_threads{application="demo",state="waiting",} 11.0
jvm_threads_states_threads{application="demo",state="blocked",} 0.0
jvm_threads_states_threads{application="demo",state="timed-waiting",} 7.0
jvm_threads_states_threads{application="demo",state="runnable",} 14.0
jvm_threads_states_threads{application="demo",state="new",} 0.0
jvm_threads_states_threads{application="demo",state="terminated",} 0.0
添加服务发现。
在左侧导航栏单击实例列表,进入可观测监控 Prometheus 版的实例列表页面。
单击目标Prometheus实例的名称。
在左侧导航栏单击服务发现,然后单击配置页签。
在配置页签可以通过以下两种方式添加服务发现。
方式一:修改默认服务发现
在默认服务发现页签,单击vpc-ecs-service-discovery右侧的详情。
在弹出的对话框中修改以下内容,然后单击确认。
将默认的端口8888改为实际的端口,例如:8080。
将默认的路径/metrics改为实际的路径,例如:/actuator/prometheus。
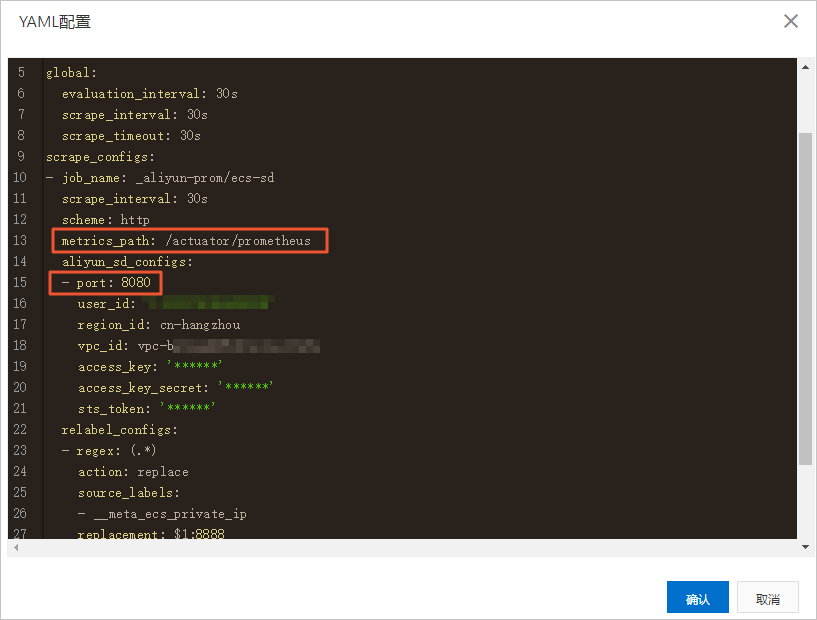
此处会采集当前VPC网络下所有ECS实例上的8080/actuator/prometheus端点。
如果您只希望采集部分ECS实例,则可以通过配置
tag_filters来对ECS实例按标签进行过滤。#格式如下 tag_filters: - key: 'testKey' values: ['testValue']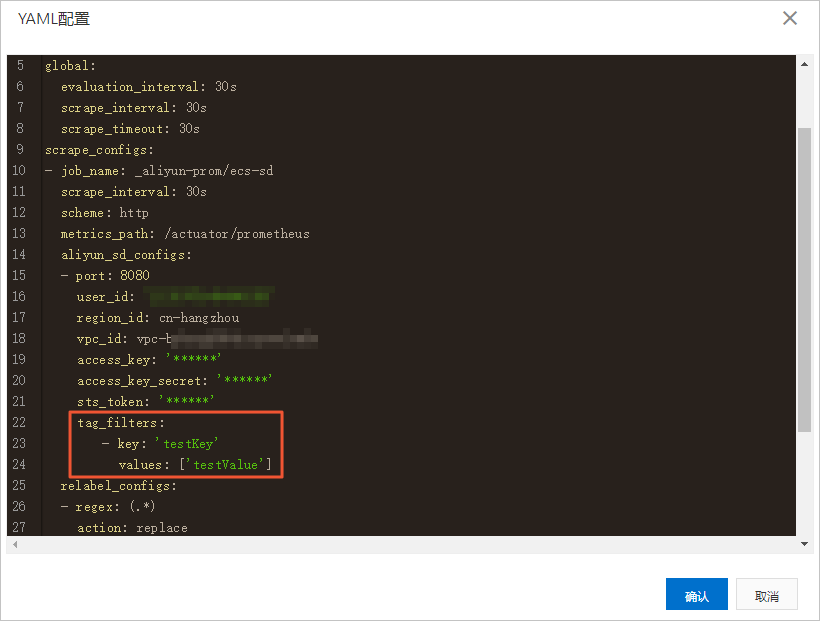
方式二:自定义服务发现
在自定义服务页签,单击新增。
在弹出的对话框,按照页面提示完成参数设置,然后单击确定。
创建Grafana大盘。
登录本地Grafana,具体操作,请参见功能入口。
在左侧导航栏选择
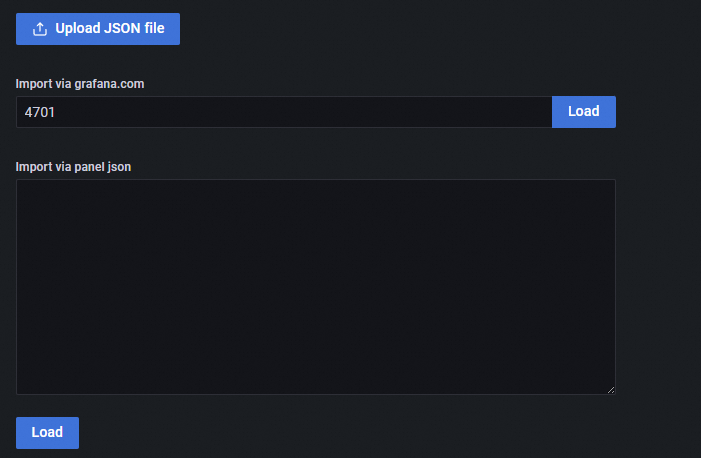
 > + Import。
在Import页面的Import via grafana.com文本框中,输入Prometheus提供的JVM大盘模板的ID4701,然后在其右侧单击Load。
说明如需获取其他Grafana大盘模板,请参见Dashboards。
在Prometheus下拉列表,选择您的VPC网络下的数据源,然后单击Import。
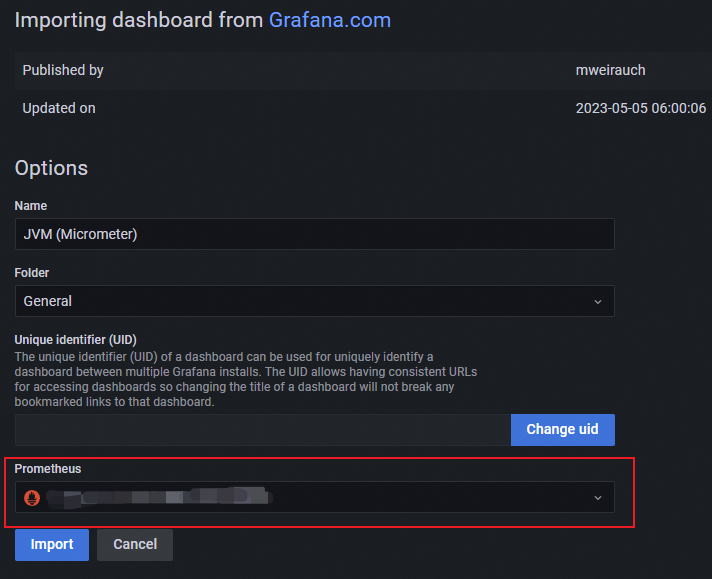
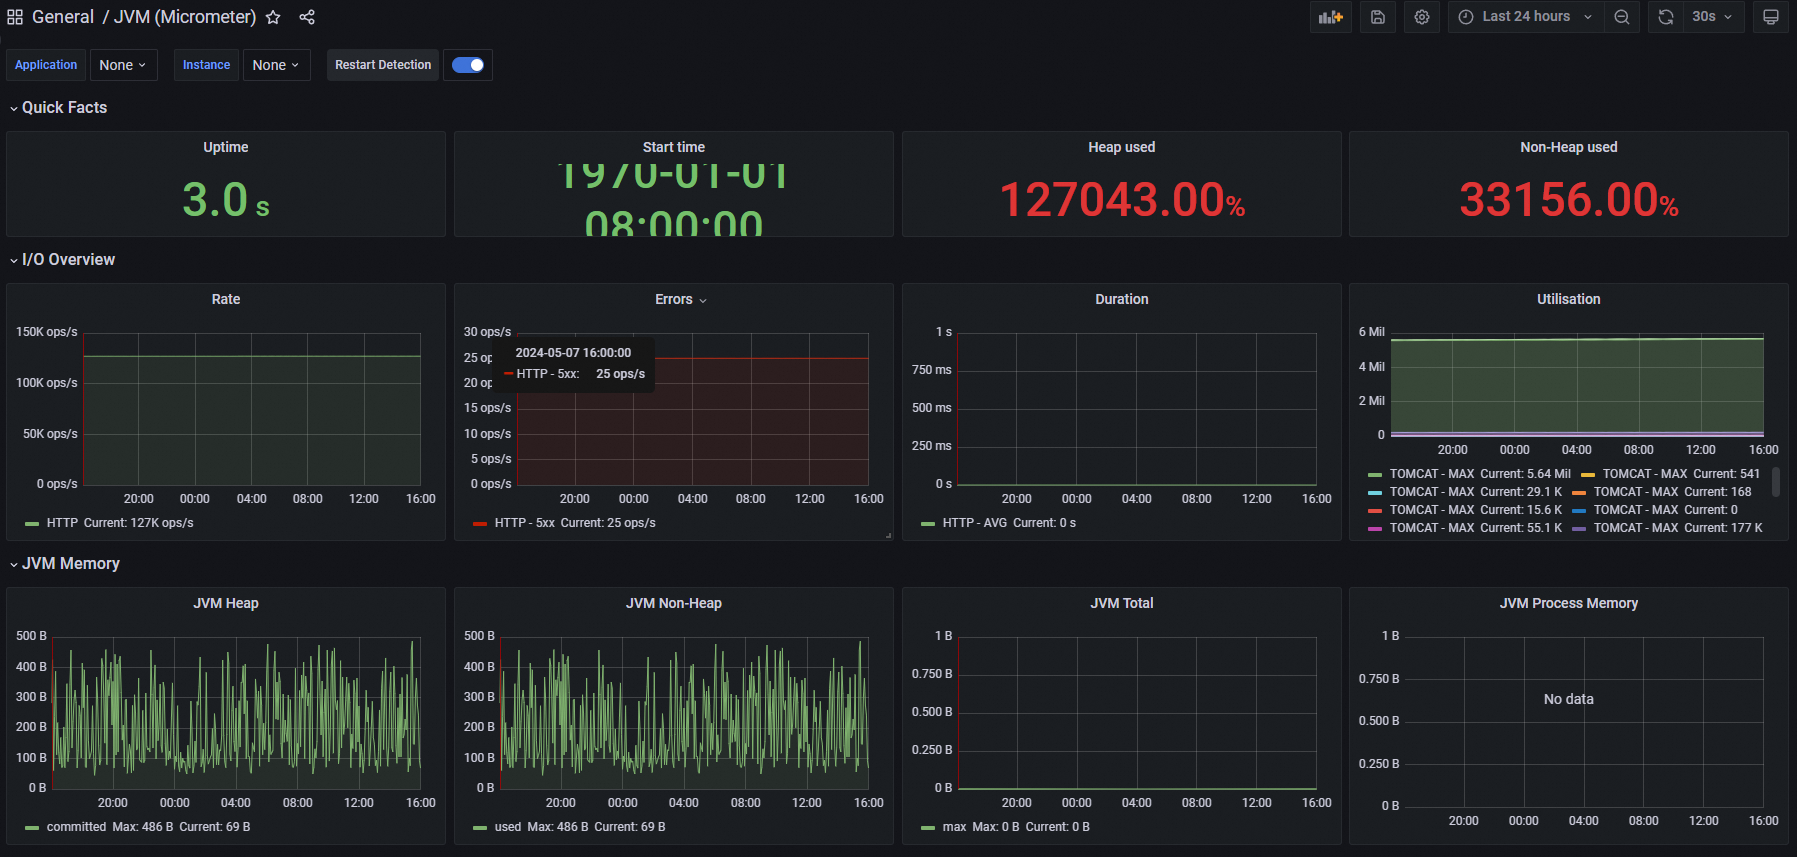
导入成功后即可查看Grafana大盘。

相关操作
如果您需要监控Java应用中某个API请求的次数,可以执行以下操作。
创建一个示例Controller,Java文件内容如下。
@RestController
@RequestMapping("/v1")
public class IndexController {

    @Autowired
    MeterRegistry registry;

    private Counter counter_index;

    @PostConstruct
    private void init(){
        counter_index = registry.counter("demo_app_requests_method_count", "method", "IndexController.index");
    }

    @RequestMapping(value = "/index")
    public Object index(){
        try{
            counter_index.increment();
        } catch (Exception e) {
            return e;
        }
        return counter_index.count();
    }

}
执行以下命令测试Java示例代码是否正常运行。
如果命令能够访问,则说明Java示例正常工作。
curl http://127.0.0.1:8080/v1/index进入上面创建的Grafana大盘页面。
单击页面右上角的
 图标,然后单击Add a new panel。
在Edit Panel页面的Query区域的下拉列表中选择VPC网络下的ECS数据源。在A折叠面板的Metrics右侧文本框输入以下PromQL查询语句。
demo_app_requests_method_count_total{application="demo",method="IndexController.index"}在右侧Panel页签输入面板的名称,例如:index count。
单击右上角的Save,在弹出的对话框中单击Save。
配置完毕后,在Grafana大盘新增的index count面板中即可查看API请求次数。
- 本页导读 (1)