通过在应用中埋点来暴露应用数据,使用Prometheus Client监控抓取数据,即可实现利用Prometheus监控应用的目的。本文以阿里云容器服务Kubernetes集群和阿里云容器镜像服务为例,介绍如何通过Prometheus Client监控应用。
前提条件
已创建Kubernetes集群。具体操作,请参见创建Kubernetes托管版集群。
已接入阿里云Prometheus监控。具体操作,请参见开启阿里云Prometheus监控。
已创建阿里云容器镜像服务镜像仓库。具体操作,请参见步骤二:创建镜像仓库。
步骤一:对应用埋点
Prometheus Client目前支持大部分编程语言,更多信息,请参见CLIENT LIBRARIES。以下示例通过对应用埋点以暴露Go应用的监控数据:
package main
import (
    "flag"
    "fmt"
    "log"
    "math"
    "math/rand"
    "net/http"
    "time"
    "github.com/prometheus/client_golang/prometheus"
    "github.com/prometheus/client_golang/prometheus/promhttp"
)

var (
    addr              = flag.String("listen-address", ":8080", "The address to listen on for HTTP requests.")
    uniformDomain     = flag.Float64("uniform.domain", 0.0002, "The domain for the uniform distribution.")
    normDomain        = flag.Float64("normal.domain", 0.0002, "The domain for the normal distribution.")
    normMean          = flag.Float64("normal.mean", 0.00001, "The mean for the normal distribution.")
    oscillationPeriod = flag.Duration("oscillation-period", 10*time.Minute, "The duration of the rate oscillation period.")
)

var (
    // Create a summary to track fictional interservice RPC latencies for three distinct services with different latency distributions.
    // These services are differentiated via a "service" label.
    rpcDurations = prometheus.NewSummaryVec(
        prometheus.SummaryOpts{
            Name:       "rpc_durations_seconds",
            Help:       "RPC latency distributions.",
            Objectives: map[float64]float64{0.5: 0.05, 0.9: 0.01, 0.99: 0.001},
        },
        []string{"service"},
    )
    // The same as above, but now as a histogram, and only for the normal
    // distribution. The buckets are targeted to the parameters of the
    // normal distribution, with 20 buckets centered on the mean, each
    // half-sigma wide.
    rpcDurationsHistogram = prometheus.NewHistogram(prometheus.HistogramOpts{
        Name:    "rpc_durations_histogram_seconds",
        Help:    "RPC latency distributions.",
        Buckets: prometheus.LinearBuckets(*normMean-5**normDomain, .5**normDomain, 20),
    })
)

func init() {
    // Register the summary and the histogram with Prometheus's default registry.
    prometheus.MustRegister(rpcDurations)
    prometheus.MustRegister(rpcDurationsHistogram)
    // Add Go module build info.
    prometheus.MustRegister(prometheus.NewBuildInfoCollector())
}

func main() {
    flag.Parse()
    start := time.Now()
    oscillationFactor := func() float64 {
        return 2 + math.Sin(math.Sin(2*math.Pi*float64(time.Since(start))/float64(*oscillationPeriod)))
    }
    // Periodically record some sample latencies for the three services.
    go func() {
        for {
            v := rand.Float64() * *uniformDomain
            rpcDurations.WithLabelValues("uniform").Observe(v)
            time.Sleep(time.Duration(100*oscillationFactor()) * time.Millisecond)
        }
    }()
    go func() {
        for {
            v := (rand.NormFloat64() * *normDomain) + *normMean
            rpcDurations.WithLabelValues("normal").Observe(v)
            // Demonstrate exemplar support with a dummy ID. This
            // would be something like a trace ID in a real
            // application.  Note the necessary type assertion. We
            // already know that rpcDurationsHistogram implements
            // the ExemplarObserver interface and thus don't need to
            // check the outcome of the type assertion.
            rpcDurationsHistogram.(prometheus.ExemplarObserver).ObserveWithExemplar(
                v, prometheus.Labels{"dummyID": fmt.Sprint(rand.Intn(100000))},
            )
            time.Sleep(time.Duration(75*oscillationFactor()) * time.Millisecond)
        }
    }()
    go func() {
        for {
            v := rand.ExpFloat64() / 1e6
            rpcDurations.WithLabelValues("exponential").Observe(v)
            time.Sleep(time.Duration(50*oscillationFactor()) * time.Millisecond)
        }
    }()
    // Expose the registered metrics via HTTP.
    http.Handle("/metrics", promhttp.HandlerFor(
        prometheus.DefaultGatherer,
        promhttp.HandlerOpts{
            // Opt into OpenMetrics to support exemplars.
            EnableOpenMetrics: true,
        },
    ))
    log.Fatal(http.ListenAndServe(*addr, nil))
}
在本示例中,相关参数说明如下:
在注册rpc_durations_seconds指标前需要注册一个监控指标prometheus.MustRegister。本示例中rpc_durations_seconds为prometheus.NewSummaryVec类型,更多其他类型,请参见Prometheus。
rpcDurations是一个全局的单例,在更新监控数据时通过调用rpcDurations.WithLabelValues("uniform").Observe(v)增加监控数据。
关于代码模板,请参见prometheus / client_golang。
步骤二:将应用制作为镜像并上传到镜像仓库
将完成埋点的应用制作成镜像并上传至阿里云容器镜像服务的镜像仓库。
执行以下命令构建镜像。
docker build -t <本地临时Docker镜像名称>:<本地临时Docker镜像版本号> . --no-cache示例命令:
docker build -t prometheus-demo:v1 . --no-cache执行以下命令为镜像打标。
sudo docker tag <本地临时Docker镜像名称>:<本地临时Docker镜像版本号> <Registry域名>/<命名空间>/<镜像名称>:<镜像版本号>示例命令:
sudo docker tag prometheus-demo:v1 registry.cn-hangzhou.aliyuncs.com/ringtail/prometheus-demo:v1执行以下命令将镜像推送至镜像仓库。
sudo docker push <Registry域名>/<命名空间>/<镜像名称>:<镜像版本号>示例命令:
sudo docker push registry.cn-hangzhou.aliyuncs.com/ringtail/prometheus-demo:v1查看已推送的镜像。
登录容器镜像服务控制台。
在顶部菜单栏,选择所需地域。
在左侧导航栏,选择实例列表。
在实例列表页面单击个人版实例。
在个人版实例管理页面选择。
在镜像仓库页面单击目标仓库操作列的管理。
在左侧导航栏,选择镜像版本。
在镜像版本列表中可查看已推送的镜像。
步骤三:将应用部署至容器服务Kubernetes集群
- 登录容器服务管理控制台。
在控制台左侧导航栏,单击集群。
在集群列表页面,单击目标集群名称或者目标集群右侧操作列下的详情。
创建容器组。
在集群管理页左侧导航栏,选择。
在容器组页面,单击使用YAML创建资源。
在创建页面的模板代码框输入以下内容,然后单击创建。
apiVersion: apps/v1 # for versions before 1.8.0 use apps/v1beta1
kind: Deployment
metadata:
  name: demo-app
  labels:
    app: demo-app
spec:
  replicas: 2
  selector:
    matchLabels:
      app: demo-app
  template:
    metadata:
      labels:
        app: demo-app
    spec:
      containers:
      - name: demo-app
        image: <Registry域名>/<命名空间>/<镜像名称>:<镜像版本号>
        command:
        - /random
        ports:
        - containerPort: 8080
示例代码:
apiVersion: apps/v1 # for versions before 1.8.0 use apps/v1beta1
kind: Deployment
metadata:
  name: demo-app
  labels:
    app: demo-app
spec:
  replicas: 2
  selector:
    matchLabels:
      app: demo-app
  template:
    metadata:
      labels:
        app: demo-app
    spec:
      containers:
      - name: demo-app
        image: registry.cn-hangzhou.aliyuncs.com/ringtail/prometheus-demo:v1
        command:
        - /random
        ports:
        - containerPort: 8080
在容器组页面可查看已创建的容器组。
创建服务。
在集群管理页左侧导航栏,选择。
在服务页面,单击使用YAML创建资源。
在创建页面的模板代码框输入以下内容,然后单击创建。
apiVersion: v1
kind: Service
metadata:
  labels:
    app: demo-app
  name: demo-app
  namespace: default
spec:
  ports:
  - name: http-metrics
    port: 8080
    protocol: TCP
    targetPort: 8080
  selector:
    app: demo-app
  type: ClusterIP
在服务页面可查看已创建的服务。
步骤四:配置服务发现
配置阿里云Prometheus监控的服务发现以抓取Go应用数据。本示例以ARMS控制台操作为例:
登录ARMS控制台。
在左侧导航栏选择,进入可观测监控 Prometheus 版的实例列表页面。
在顶部菜单栏,选择集群所在的地域。
- 单击目标Prometheus实例名称,进入集成中心页面。
在集成中心的左侧导航栏单击服务发现,然后单击配置页签,在ServiceMonitor页签下,单击添加ServiceMonitor。
在添加ServiceMonitor对话框中输入以下内容,然后单击确定。
apiVersion: monitoring.coreos.com/v1 kind: ServiceMonitor metadata: labels: app: demo-app name: demo-app namespace: default spec: endpoints: - interval: 30s port: http-metrics jobLabel: app namespaceSelector: matchNames: - default selector: matchLabels: app: demo-app在ServiceMonitor页签下可查看已配置的服务发现。
步骤五:验证Prometheus Client是否支持通过指标监控应用数据
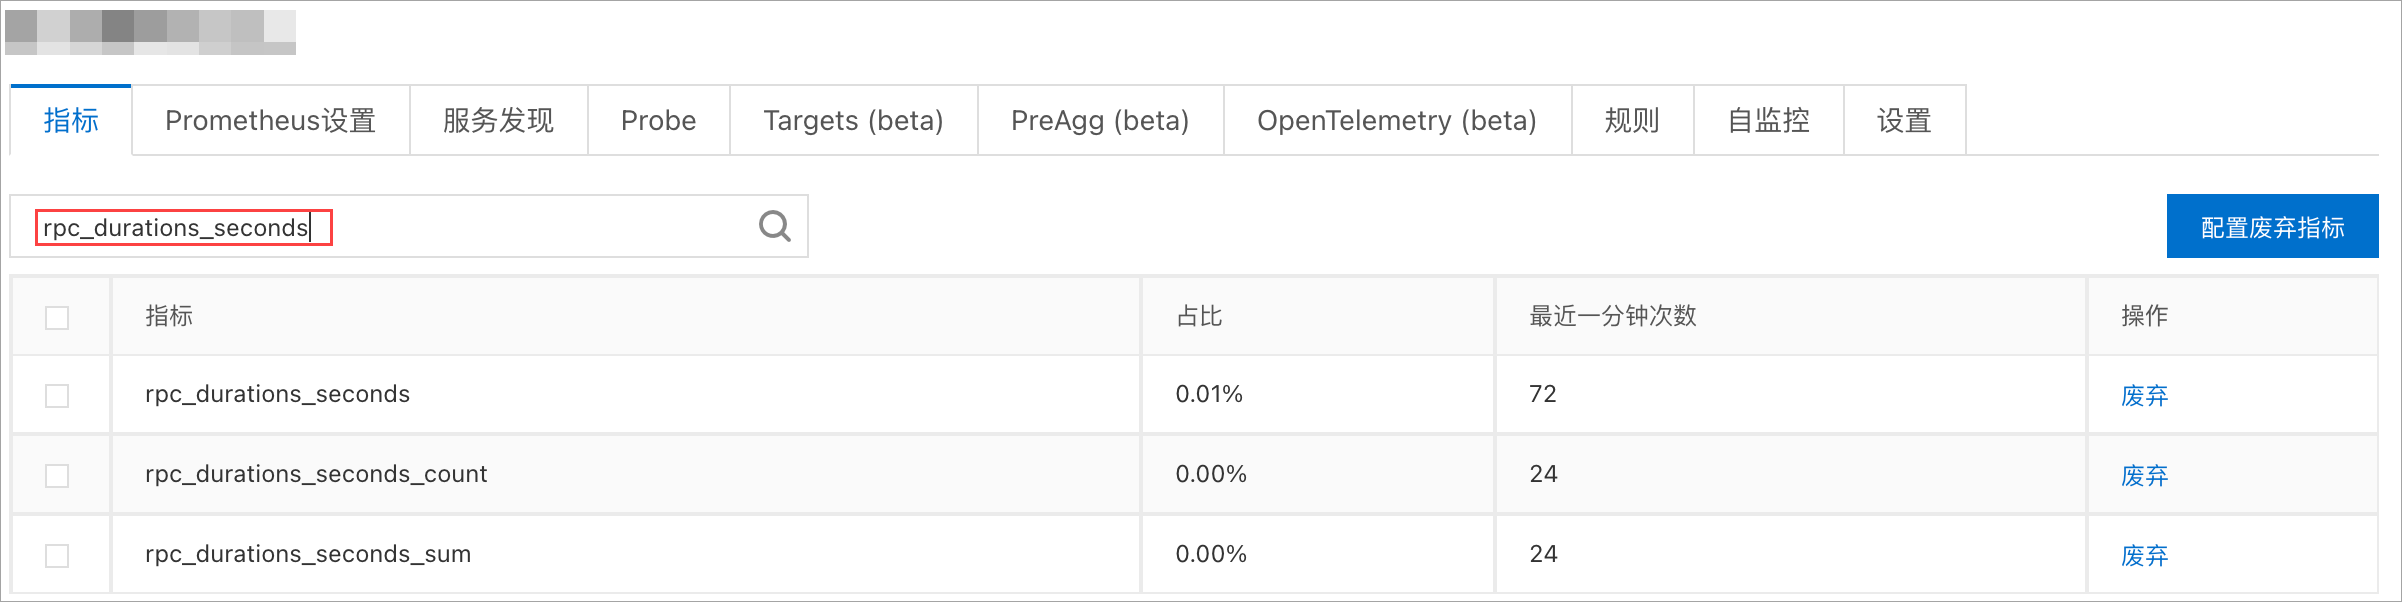
在服务发现页面,单击指标页签。
在搜索框输入步骤一:对应用埋点注册的指标rpc_durations_seconds,单击
 图标。
图标。若查询到指标rpc_durations_seconds,表示Prometheus Client已通过该指标监控应用数据。
- 本页导读 (1)